> ## Documentation Index
> Fetch the complete documentation index at: https://docs.featpaper.com/llms.txt
> Use this file to discover all available pages before exploring further.
# See Who's Reading
> Learn how to leverage document viewing data and AI insights.
## Analytics Dashboard
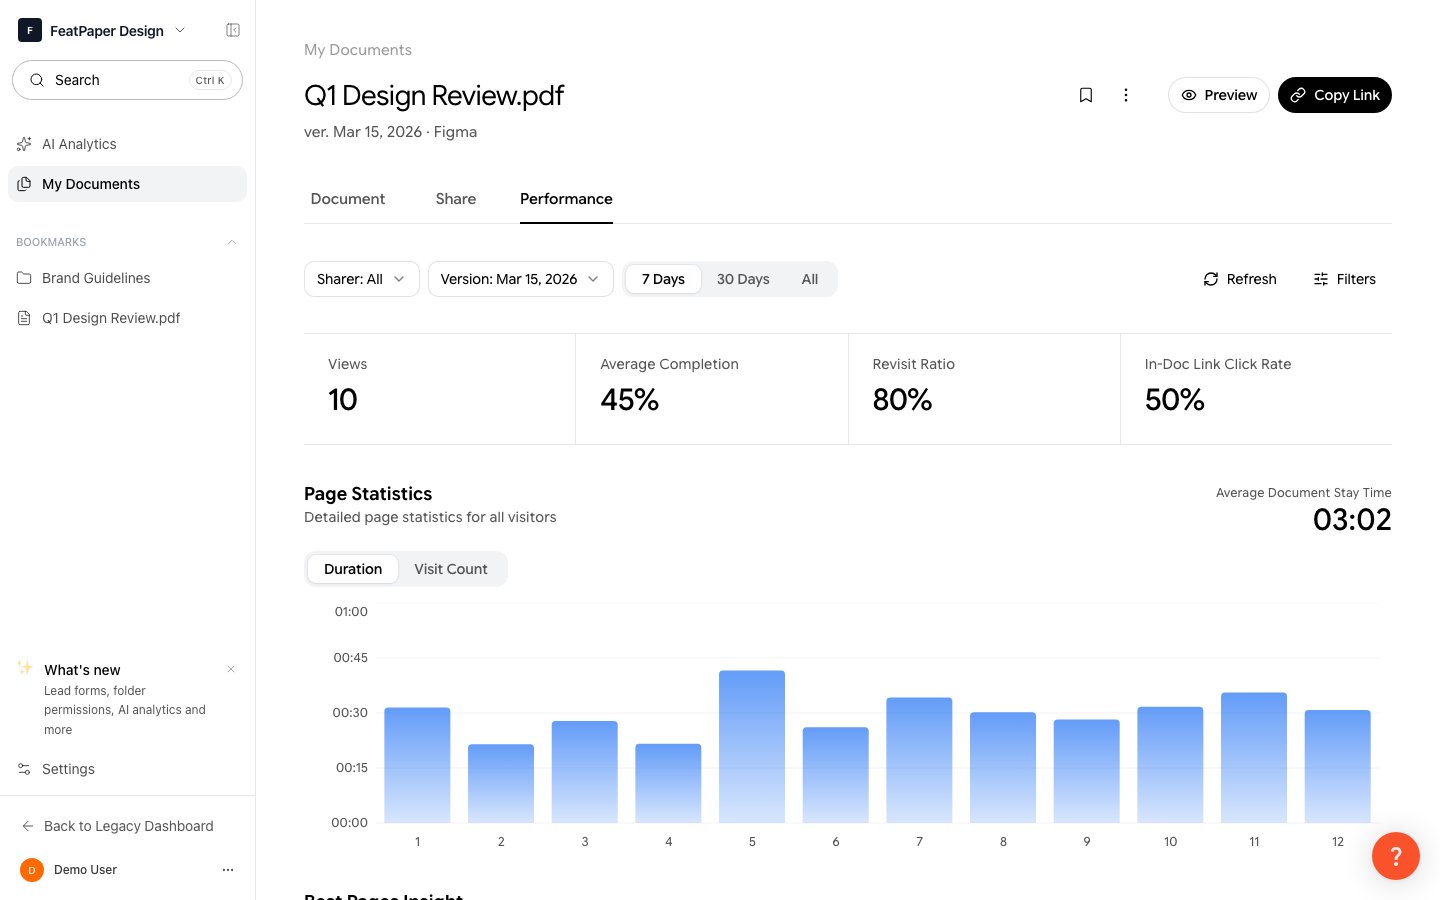
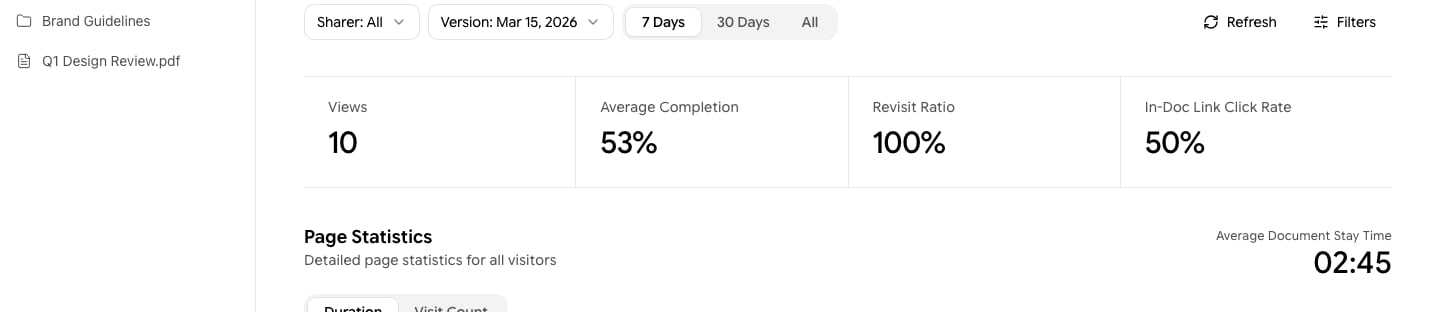
After sharing a document, you can monitor viewer behavior data in real time. Click on a document to navigate to the analytics dashboard.
 ### Data Access by Permission
The scope of analytics data you can view depends on your permission level for the parent folder of the document.
| Permission | Viewing Scope |
| --------------------------- | ----------------------------------------------------------------------------------------------------------------------------------- |
| **Edit permission (Admin)** | View all visitor data for the document. You can also use the member filter to see data only from links shared by a specific member. |
| **View permission** | View only the data generated through links you shared. Data from other members is not displayed. |
**Free plan limitation**: On the Free plan, only **7 days of data** from the document upload date is available. The date range selector is locked, and changing the period, version, and share link filters is restricted. Locked items display a padlock icon — clicking one shows a plan upgrade prompt. On the Pro plan and above, the date range and all filters are available without restriction.
### Key Metrics
| Metric | Description |
| ------------- | ----------------------------------------------------------------------------------------------------- |
| **Views** | The total number of times the document was opened via a share link. |
| **Visitors** | The number of unique visitors who viewed the document. Multiple visits by the same user count as one. |
| **Feedback** | An engagement classification based on viewer reading patterns. (Hot/Warm/Cold) |
| **Read Time** | The total time viewers spent reading the document. Displayed in `mm:ss` or `hh:mm:ss` format. |
Visitors who viewed the document without signing in are displayed as **Anonymous**.
***
## Filters
You can filter data by various conditions using the filter panel at the top of the analytics dashboard.
### Data Access by Permission
The scope of analytics data you can view depends on your permission level for the parent folder of the document.
| Permission | Viewing Scope |
| --------------------------- | ----------------------------------------------------------------------------------------------------------------------------------- |
| **Edit permission (Admin)** | View all visitor data for the document. You can also use the member filter to see data only from links shared by a specific member. |
| **View permission** | View only the data generated through links you shared. Data from other members is not displayed. |
**Free plan limitation**: On the Free plan, only **7 days of data** from the document upload date is available. The date range selector is locked, and changing the period, version, and share link filters is restricted. Locked items display a padlock icon — clicking one shows a plan upgrade prompt. On the Pro plan and above, the date range and all filters are available without restriction.
### Key Metrics
| Metric | Description |
| ------------- | ----------------------------------------------------------------------------------------------------- |
| **Views** | The total number of times the document was opened via a share link. |
| **Visitors** | The number of unique visitors who viewed the document. Multiple visits by the same user count as one. |
| **Feedback** | An engagement classification based on viewer reading patterns. (Hot/Warm/Cold) |
| **Read Time** | The total time viewers spent reading the document. Displayed in `mm:ss` or `hh:mm:ss` format. |
Visitors who viewed the document without signing in are displayed as **Anonymous**.
***
## Filters
You can filter data by various conditions using the filter panel at the top of the analytics dashboard.
 | Filter | Description | Plan Restriction |
| ----------------------------- | ------------------------------------------------------------------------------------------------------------- | ----------------------------------- |
| **Period** | Select the last 7 days, last 1 month, or a custom date range from the calendar. | Free: fixed to 7 days, locked |
| **Shared by** | For Admins, filter to see data only from links shared by a specific member. | Free: locked |
| **Version** | View data for a specific version of the document. Versions uploaded after 7 days are locked on the Free plan. | Free: versions beyond 7 days locked |
| **Referrer** | Filter by where visitors came from (direct, email, specific domain, etc.). | — |
| **Parameters (Query String)** | Filter by UTM parameters (utm\_medium, utm\_campaign, utm\_content, utm\_term, etc.). | — |
Adding UTM parameters to share links lets you precisely analyze performance by marketing channel.
***
## Feedback Analysis
Viewer engagement is automatically classified into three tiers based on reading patterns. This is not feedback left directly by viewers — it is an **automatic classification based on the reading rate (percentage of pages read)**.
| Filter | Description | Plan Restriction |
| ----------------------------- | ------------------------------------------------------------------------------------------------------------- | ----------------------------------- |
| **Period** | Select the last 7 days, last 1 month, or a custom date range from the calendar. | Free: fixed to 7 days, locked |
| **Shared by** | For Admins, filter to see data only from links shared by a specific member. | Free: locked |
| **Version** | View data for a specific version of the document. Versions uploaded after 7 days are locked on the Free plan. | Free: versions beyond 7 days locked |
| **Referrer** | Filter by where visitors came from (direct, email, specific domain, etc.). | — |
| **Parameters (Query String)** | Filter by UTM parameters (utm\_medium, utm\_campaign, utm\_content, utm\_term, etc.). | — |
Adding UTM parameters to share links lets you precisely analyze performance by marketing channel.
***
## Feedback Analysis
Viewer engagement is automatically classified into three tiers based on reading patterns. This is not feedback left directly by viewers — it is an **automatic classification based on the reading rate (percentage of pages read)**.
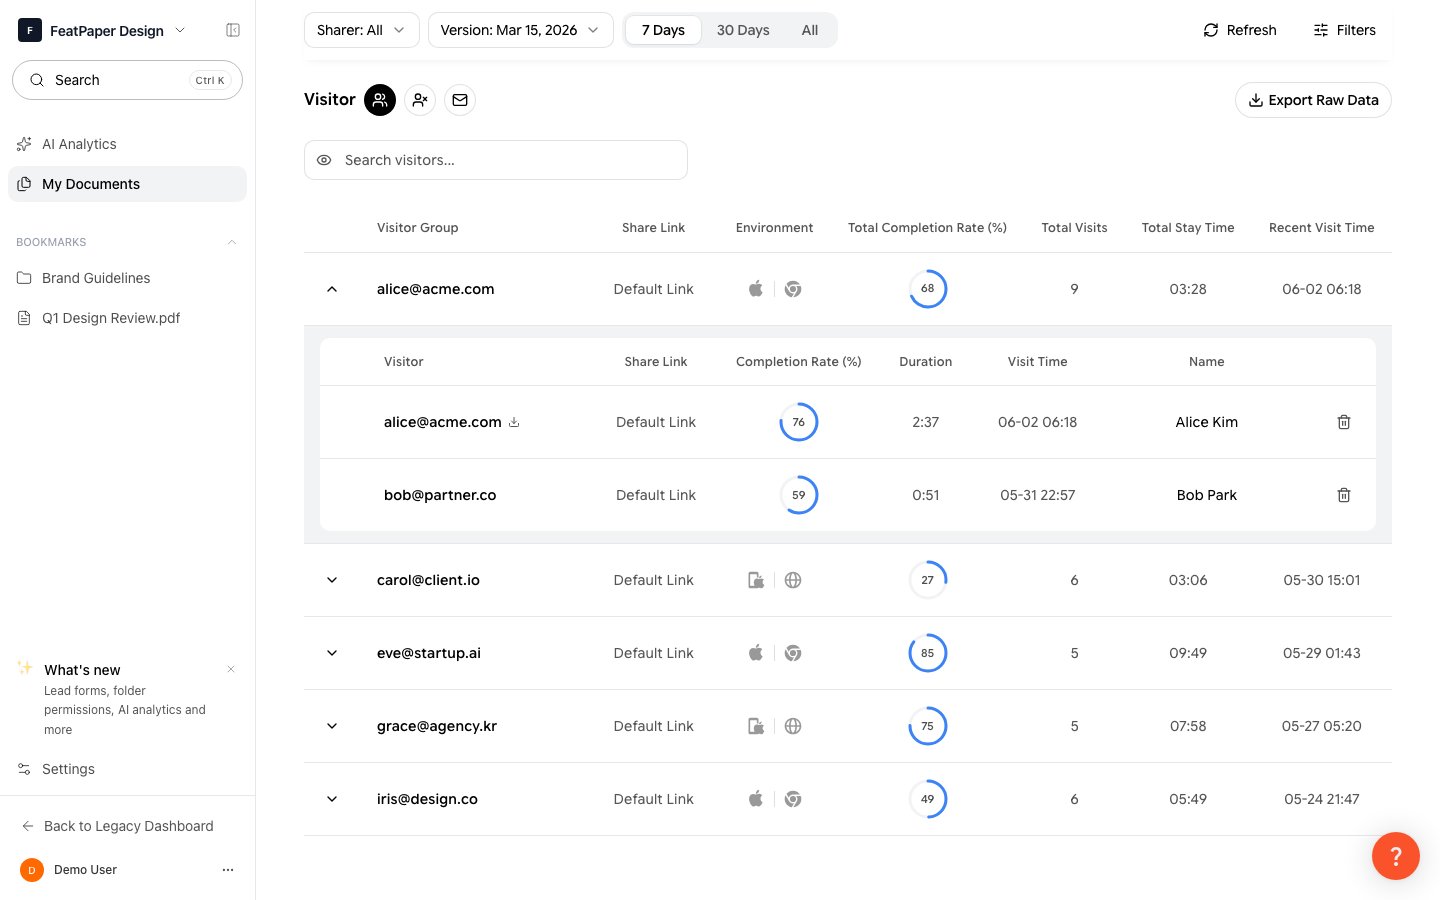 | Grade | Condition | Meaning |
| -------- | ------------------------------------------------------------- | ------------------------------- |
| **Hot** | 70% or more of pages read, or 50%+ read with 3+ page revisits | Viewer showed high interest |
| **Warm** | 50% or more of pages read | Viewer showed moderate interest |
| **Cold** | Less than 50% read | Viewer showed low interest |
A page is counted as read only when the viewer has spent at least 0.5 seconds on it.
***
## Analytics Sections
The following sections are available in the analytics dashboard.
### Sources
See where visitors came from. Traffic is broken down by referrer domain, including direct access, email, and specific websites.
### Geography
View the distribution of visitors by **country** and **city** based on GeoIP data.
### Devices
View visitor access environments across three dimensions.
| Grade | Condition | Meaning |
| -------- | ------------------------------------------------------------- | ------------------------------- |
| **Hot** | 70% or more of pages read, or 50%+ read with 3+ page revisits | Viewer showed high interest |
| **Warm** | 50% or more of pages read | Viewer showed moderate interest |
| **Cold** | Less than 50% read | Viewer showed low interest |
A page is counted as read only when the viewer has spent at least 0.5 seconds on it.
***
## Analytics Sections
The following sections are available in the analytics dashboard.
### Sources
See where visitors came from. Traffic is broken down by referrer domain, including direct access, email, and specific websites.
### Geography
View the distribution of visitors by **country** and **city** based on GeoIP data.
### Devices
View visitor access environments across three dimensions.
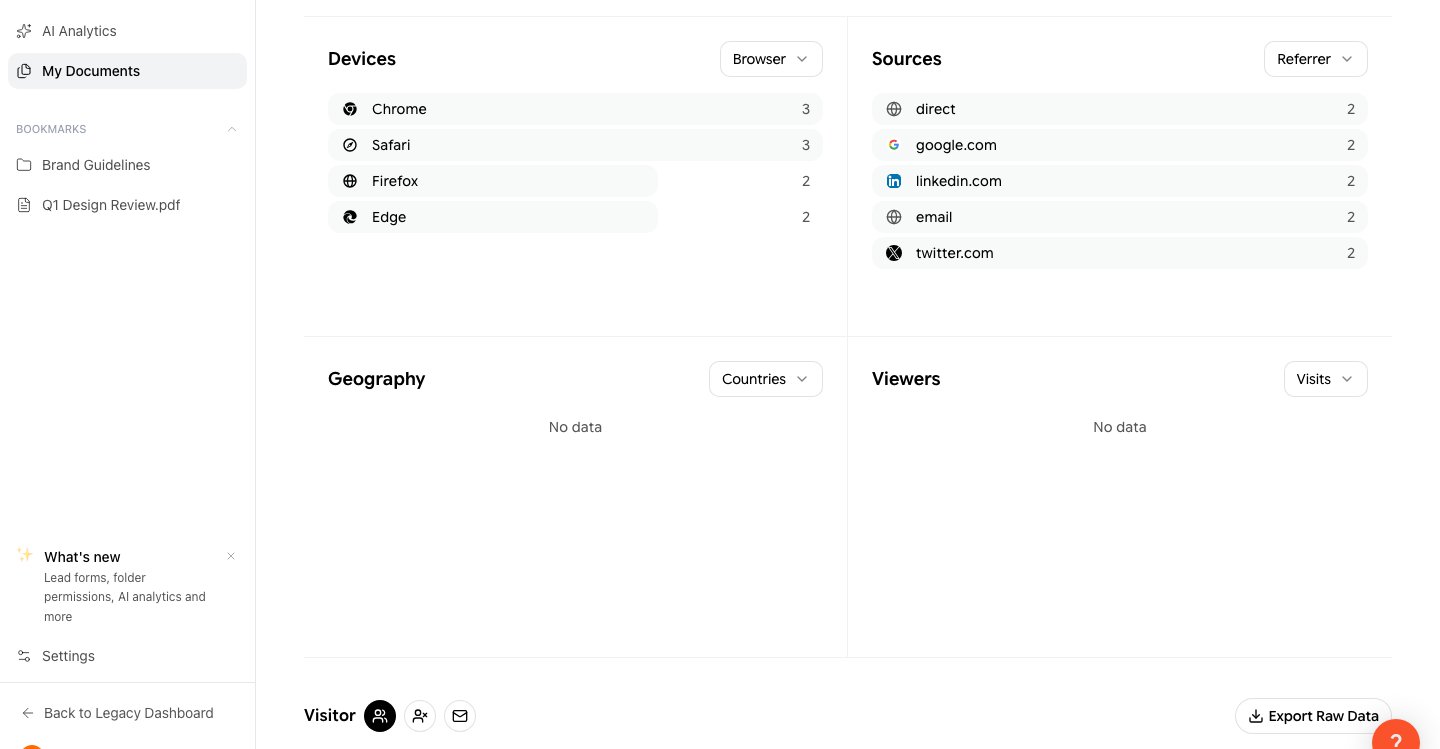 | Dimension | Examples |
| -------------------- | ---------------------------------- |
| **Browser** | Chrome, Safari, Edge, etc. |
| **Operating System** | Windows, macOS, iOS, Android, etc. |
| **Device Type** | Desktop, Mobile, Tablet |
### Page-Level Analytics
Analyze the viewing patterns for each page. Identify which pages attracted the most attention and where viewers dropped off.
***
## AI Analytics
Access AI-powered document insights from the **AI Analytics** menu in the sidebar.
| Dimension | Examples |
| -------------------- | ---------------------------------- |
| **Browser** | Chrome, Safari, Edge, etc. |
| **Operating System** | Windows, macOS, iOS, Android, etc. |
| **Device Type** | Desktop, Mobile, Tablet |
### Page-Level Analytics
Analyze the viewing patterns for each page. Identify which pages attracted the most attention and where viewers dropped off.
***
## AI Analytics
Access AI-powered document insights from the **AI Analytics** menu in the sidebar.
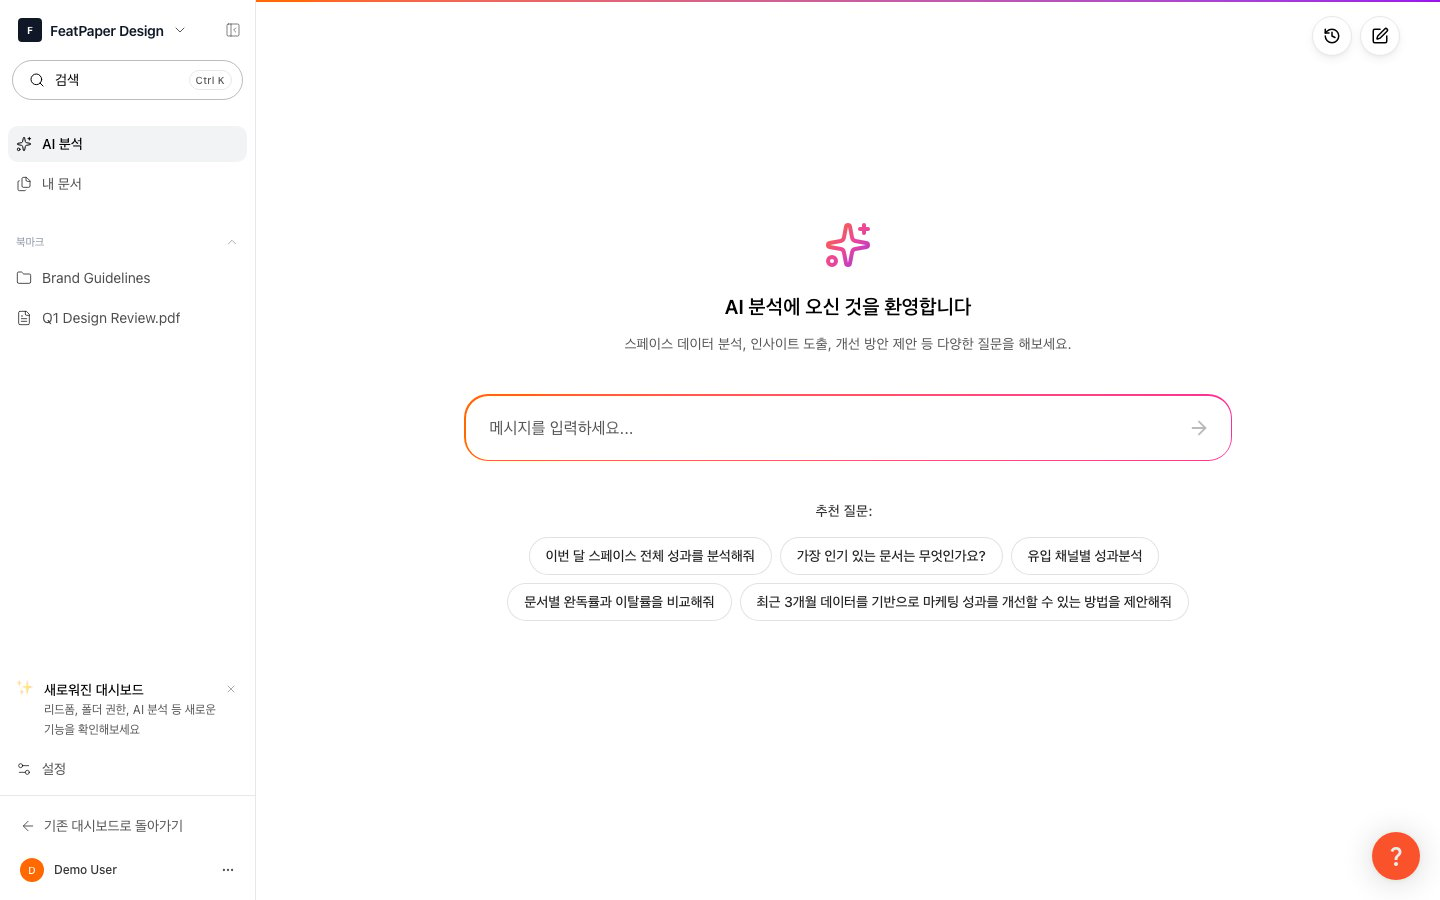 Click **AI Analytics** in the sidebar.
AI summarizes document performance based on viewing data. Quickly grasp key trends, popular pages, and viewing patterns at a glance.
Ask the AI additional questions, such as "Which page is the most popular?" or "Who spent the most time reading?"
AI Analytics is available on the **Pro plan and above** and deducts credits when used.
***
## Analytics Data Retention
| Plan | Retention Period |
| -------------- | ---------------- |
| **Free** | 7 days |
| **Pro** | Unlimited |
| **Business** | Unlimited |
| **Enterprise** | Unlimited |
On the Free plan, data older than 7 days from the document upload date is restricted. The date range selector, period filter, and version filter are locked — clicking a locked item opens the plan upgrade screen. For long-term analytics, upgrade to the Pro plan or higher.
***
## Next Steps
Learn how to share documents and collect viewing data.
Learn how to update documents while retaining analytics data.
Click **AI Analytics** in the sidebar.
AI summarizes document performance based on viewing data. Quickly grasp key trends, popular pages, and viewing patterns at a glance.
Ask the AI additional questions, such as "Which page is the most popular?" or "Who spent the most time reading?"
AI Analytics is available on the **Pro plan and above** and deducts credits when used.
***
## Analytics Data Retention
| Plan | Retention Period |
| -------------- | ---------------- |
| **Free** | 7 days |
| **Pro** | Unlimited |
| **Business** | Unlimited |
| **Enterprise** | Unlimited |
On the Free plan, data older than 7 days from the document upload date is restricted. The date range selector, period filter, and version filter are locked — clicking a locked item opens the plan upgrade screen. For long-term analytics, upgrade to the Pro plan or higher.
***
## Next Steps
Learn how to share documents and collect viewing data.
Learn how to update documents while retaining analytics data.