
Analytics Dashboard
After sharing a document, you can monitor viewer behavior data in real time. Click on a document to navigate to the analytics dashboard.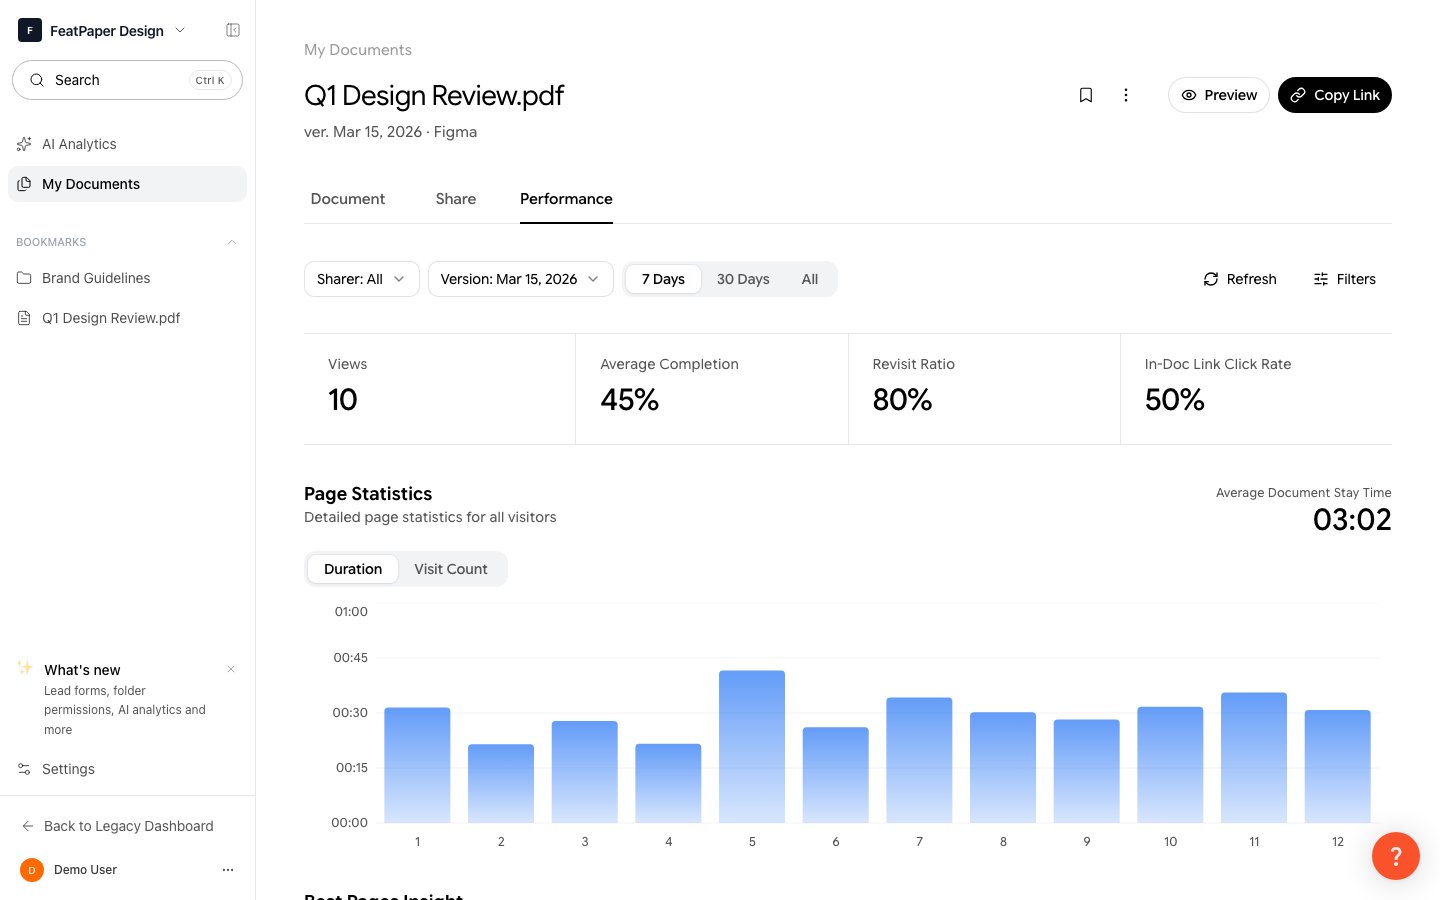
Data Access by Permission
The scope of analytics data you can view depends on your permission level for the parent folder of the document.| Permission | Viewing Scope |
|---|---|
| Edit permission (Admin) | View all visitor data for the document. You can also use the member filter to see data only from links shared by a specific member. |
| View permission | View only the data generated through links you shared. Data from other members is not displayed. |
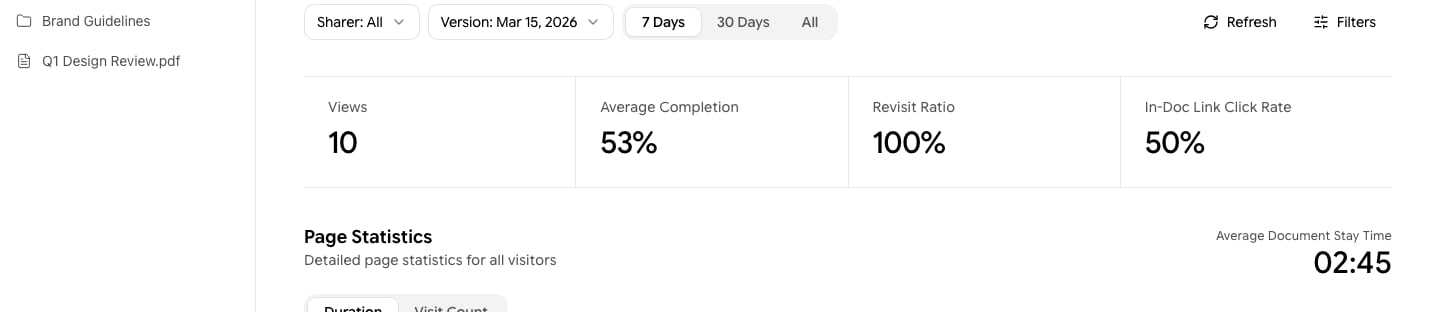
Key Metrics
| Metric | Description |
|---|---|
| Views | The total number of times the document was opened via a share link. |
| Visitors | The number of unique visitors who viewed the document. Multiple visits by the same user count as one. |
| Feedback | An engagement classification based on viewer reading patterns. (Hot/Warm/Cold) |
| Read Time | The total time viewers spent reading the document. Displayed in mm:ss or hh:mm:ss format. |
Visitors who viewed the document without signing in are displayed as Anonymous.
Filters
You can filter data by various conditions using the filter panel at the top of the analytics dashboard.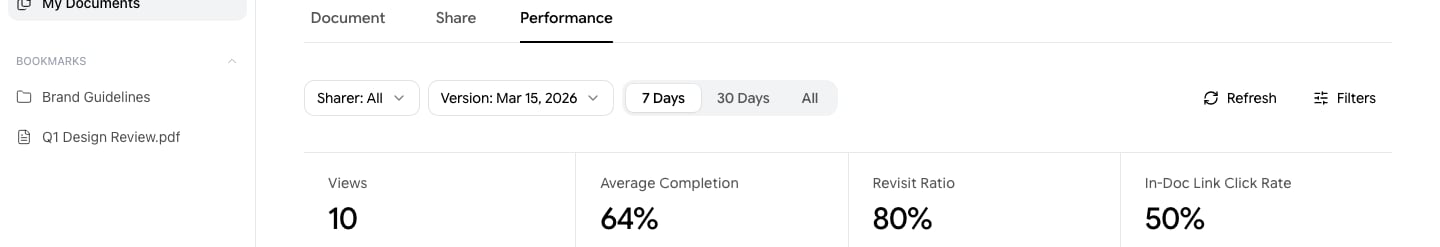
| Filter | Description | Plan Restriction |
|---|---|---|
| Period | Select the last 7 days, last 1 month, or a custom date range from the calendar. | Free: fixed to 7 days, locked |
| Shared by | For Admins, filter to see data only from links shared by a specific member. | Free: locked |
| Version | View data for a specific version of the document. Versions uploaded after 7 days are locked on the Free plan. | Free: versions beyond 7 days locked |
| Referrer | Filter by where visitors came from (direct, email, specific domain, etc.). | — |
| Parameters (Query String) | Filter by UTM parameters (utm_medium, utm_campaign, utm_content, utm_term, etc.). | — |
Feedback Analysis
Viewer engagement is automatically classified into three tiers based on reading patterns. This is not feedback left directly by viewers — it is an automatic classification based on the reading rate (percentage of pages read).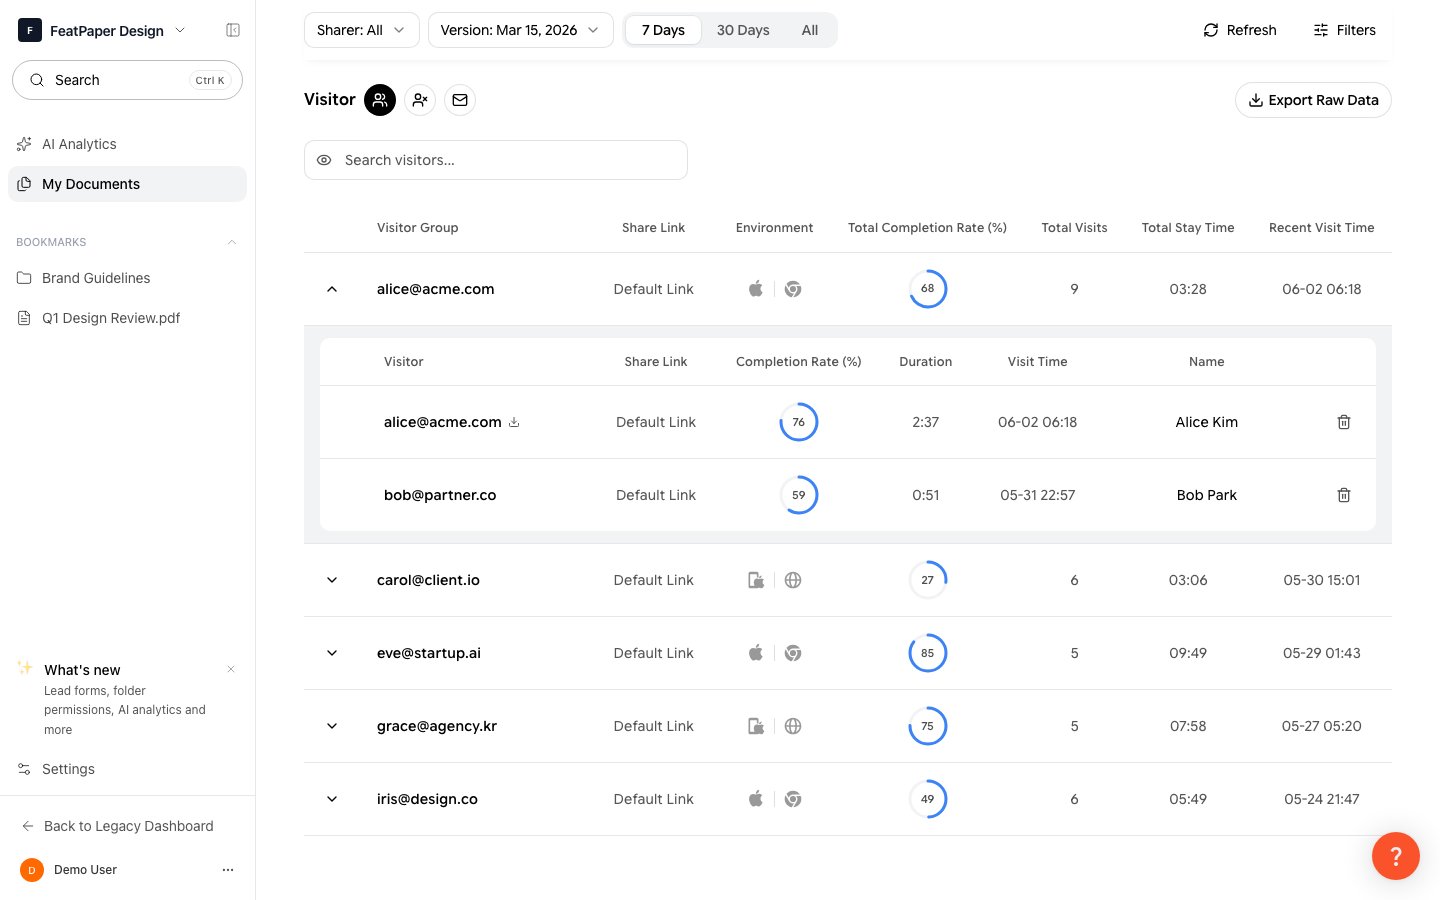
| Grade | Condition | Meaning |
|---|---|---|
| Hot | 70% or more of pages read, or 50%+ read with 3+ page revisits | Viewer showed high interest |
| Warm | 50% or more of pages read | Viewer showed moderate interest |
| Cold | Less than 50% read | Viewer showed low interest |
A page is counted as read only when the viewer has spent at least 0.5 seconds on it.
Analytics Sections
The following sections are available in the analytics dashboard.Sources
See where visitors came from. Traffic is broken down by referrer domain, including direct access, email, and specific websites.Geography
View the distribution of visitors by country and city based on GeoIP data.Devices
View visitor access environments across three dimensions.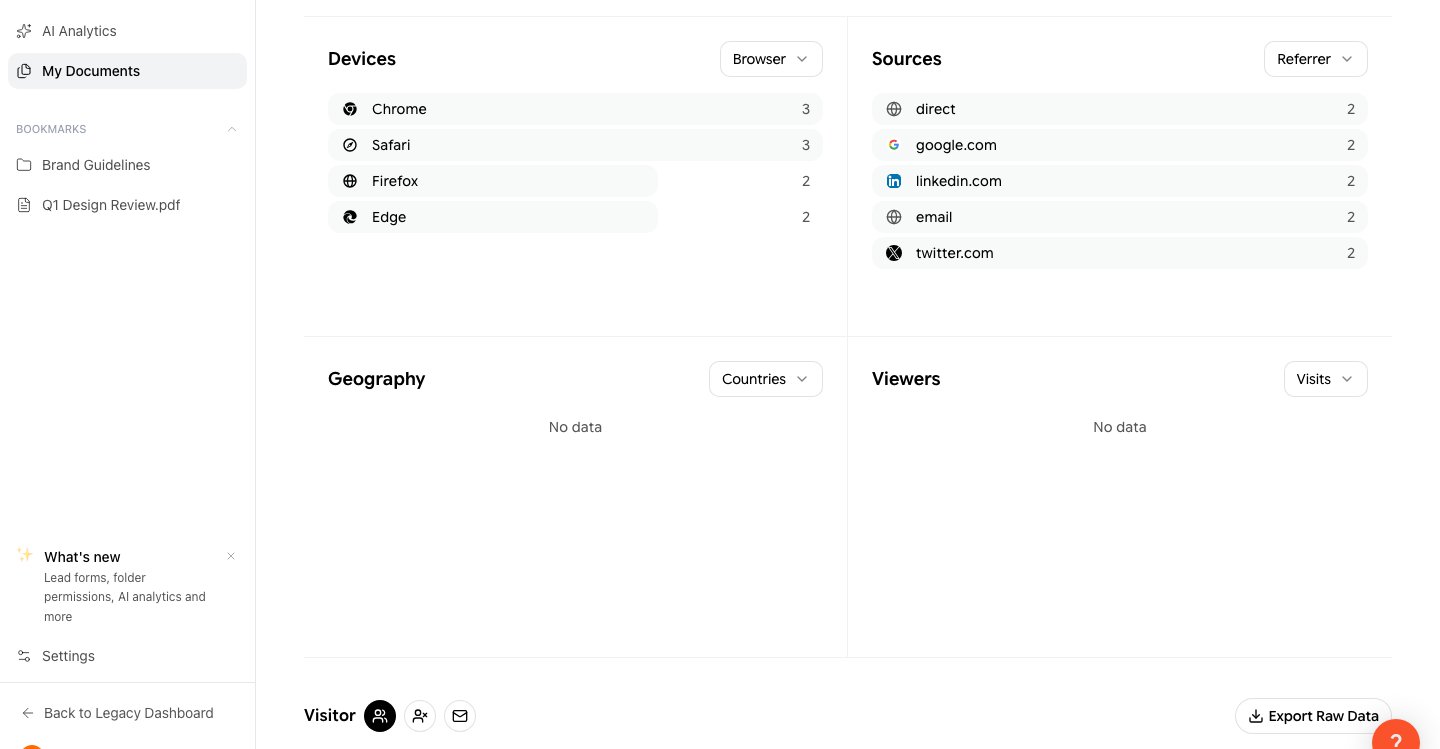
| Dimension | Examples |
|---|---|
| Browser | Chrome, Safari, Edge, etc. |
| Operating System | Windows, macOS, iOS, Android, etc. |
| Device Type | Desktop, Mobile, Tablet |
Page-Level Analytics
Analyze the viewing patterns for each page. Identify which pages attracted the most attention and where viewers dropped off.AI Analytics
Access AI-powered document insights from the AI Analytics menu in the sidebar.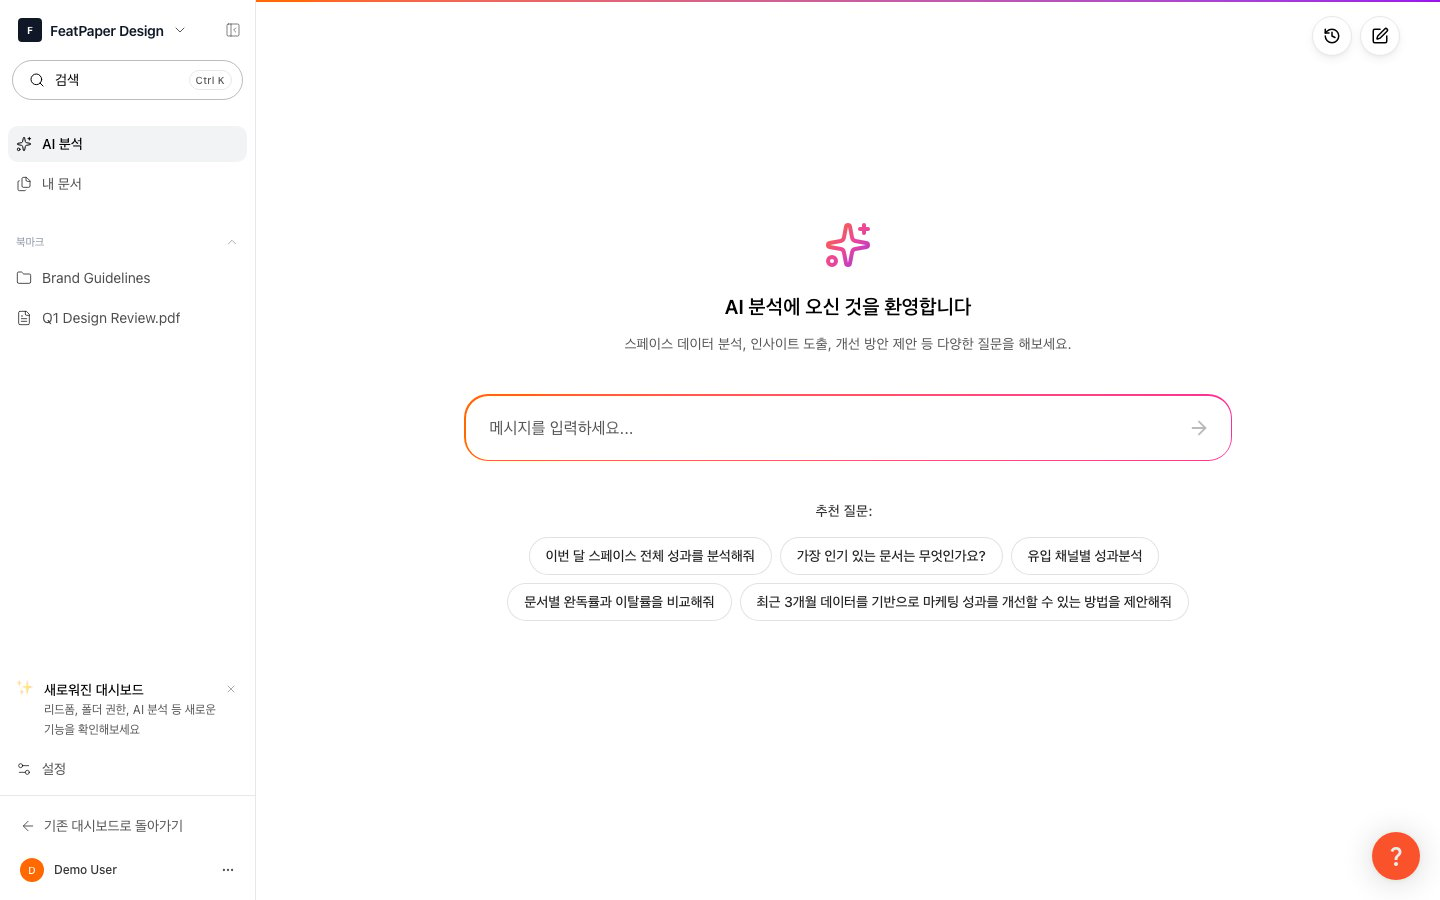
Review Analysis Summary
AI summarizes document performance based on viewing data. Quickly grasp key trends, popular pages, and viewing patterns at a glance.
AI Analytics is available on the Pro plan and above and deducts credits when used.
Analytics Data Retention
| Plan | Retention Period |
|---|---|
| Free | 7 days |
| Pro | Unlimited |
| Business | Unlimited |
| Enterprise | Unlimited |
Next Steps
Create a Share Link
Learn how to share documents and collect viewing data.
Version Management
Learn how to update documents while retaining analytics data.